A well constructed manufacturing training matrix can provide benefits ranging from minimizing downtime to improving quality outcomes, but requires some important consideration during design, implementation and maintenance.
Table of Contents
This is some text inside of a div block.
A well-designed manufacturing training matrix is a visualization of employee capabilities. Even in its most basic form, a matrix displays a dataset that compares “work” against “workers who can do that work”.
While commonly referred to as a “training” matrix, it can contain more than training completion records. These visualizations can and should include more holistic capability data related to experience, compliance requirements, and even the availability of workers, all of which make them powerful tools on the shop floor for a variety of user types.
Why build a training matrix for the shop floor?
A well constructed training matrix can provide benefits ranging from minimizing downtime to improving quality outcomes.
For an individual operator, a matrix can provide visibility into relevant capabilities for their own career progression so that they can take steps to identify where to invest their time.
For safety, quality and compliance teams, training matrices are also useful. For instance, they serve a valuable function in process control by ensuring that only operators who meet specific requirements are assigned to specific tasks, reducing quality and compliance risks. They act as an especially important artifact when auditors spot check that a person has been trained on the task they’re performing.
Forplant leaders, training matrices can serve as a foundational workforce planning tool. A matrix can be an important data source to help leadership understand whether the current workforce is capable of meeting future operational demands, and, if not, what actions they need to take to fill any gaps.
Getting started: Keep it simple and focus on finding the right elevation
Across all of the use cases above, a manufacturing training matrix increases in value as the quality of the capability data found within it improves.
When building out a matrix for the first time, we always recommend matching work to defined capabilities as directly as possible. Start by defining each process that needs to occur during a shift within an area, and then evaluate each team member with a simple binary logic: “YES” they can do it, or “NO” they cannot. Adding more granularity and complexity over time can bring additional value, but first ensure that it meets its primary goal of answering “who can work where”.
That said, building a training matrix should be an iterative process. Collect feedback from people who rely on it, find out what’s working and what isn’t, then change the matrix dataset accordingly. Drill a layer deeper into what makes this a “yes” or a “no”. Did they complete the prerequisite training? Have they maintained consistent performance? Do they have all of their certifications up to date? etc.
Along with user feedback, optimizing the matrix can come from uncovering overlapping requirements. For example, identifying multiple processes that share underlying requirements can mean building a single tracked capability versus multiple. In practice, this could arm frontline leaders with a broader pool of potential operators that meet requirements.
Match visual format with operational needs
There are many ways to go about building the matrix. If there is one lesson that we’ve learned working with clients, it’s that a matrix is only as useful as it is readable.
The visuals within the matrix should always be intuitive and easy to understand at a glance.Try to reduce cognitive load as much as possible. Whether it’s before or during a shift, frontline leaders usually don’t have the time to comb through a ton of data points or consult a complex key to find the information that they need.
There are many different ways to display information on the matrix itself, and the best solution will come down to your specific use case and operation. There will be tradeoffs to make on the visual, so it’s important to evaluate the pros and cons of each and maintain open lines of communication with frontline leaders as you build it out to ensure you are prioritizing the right things. Here are some examples:
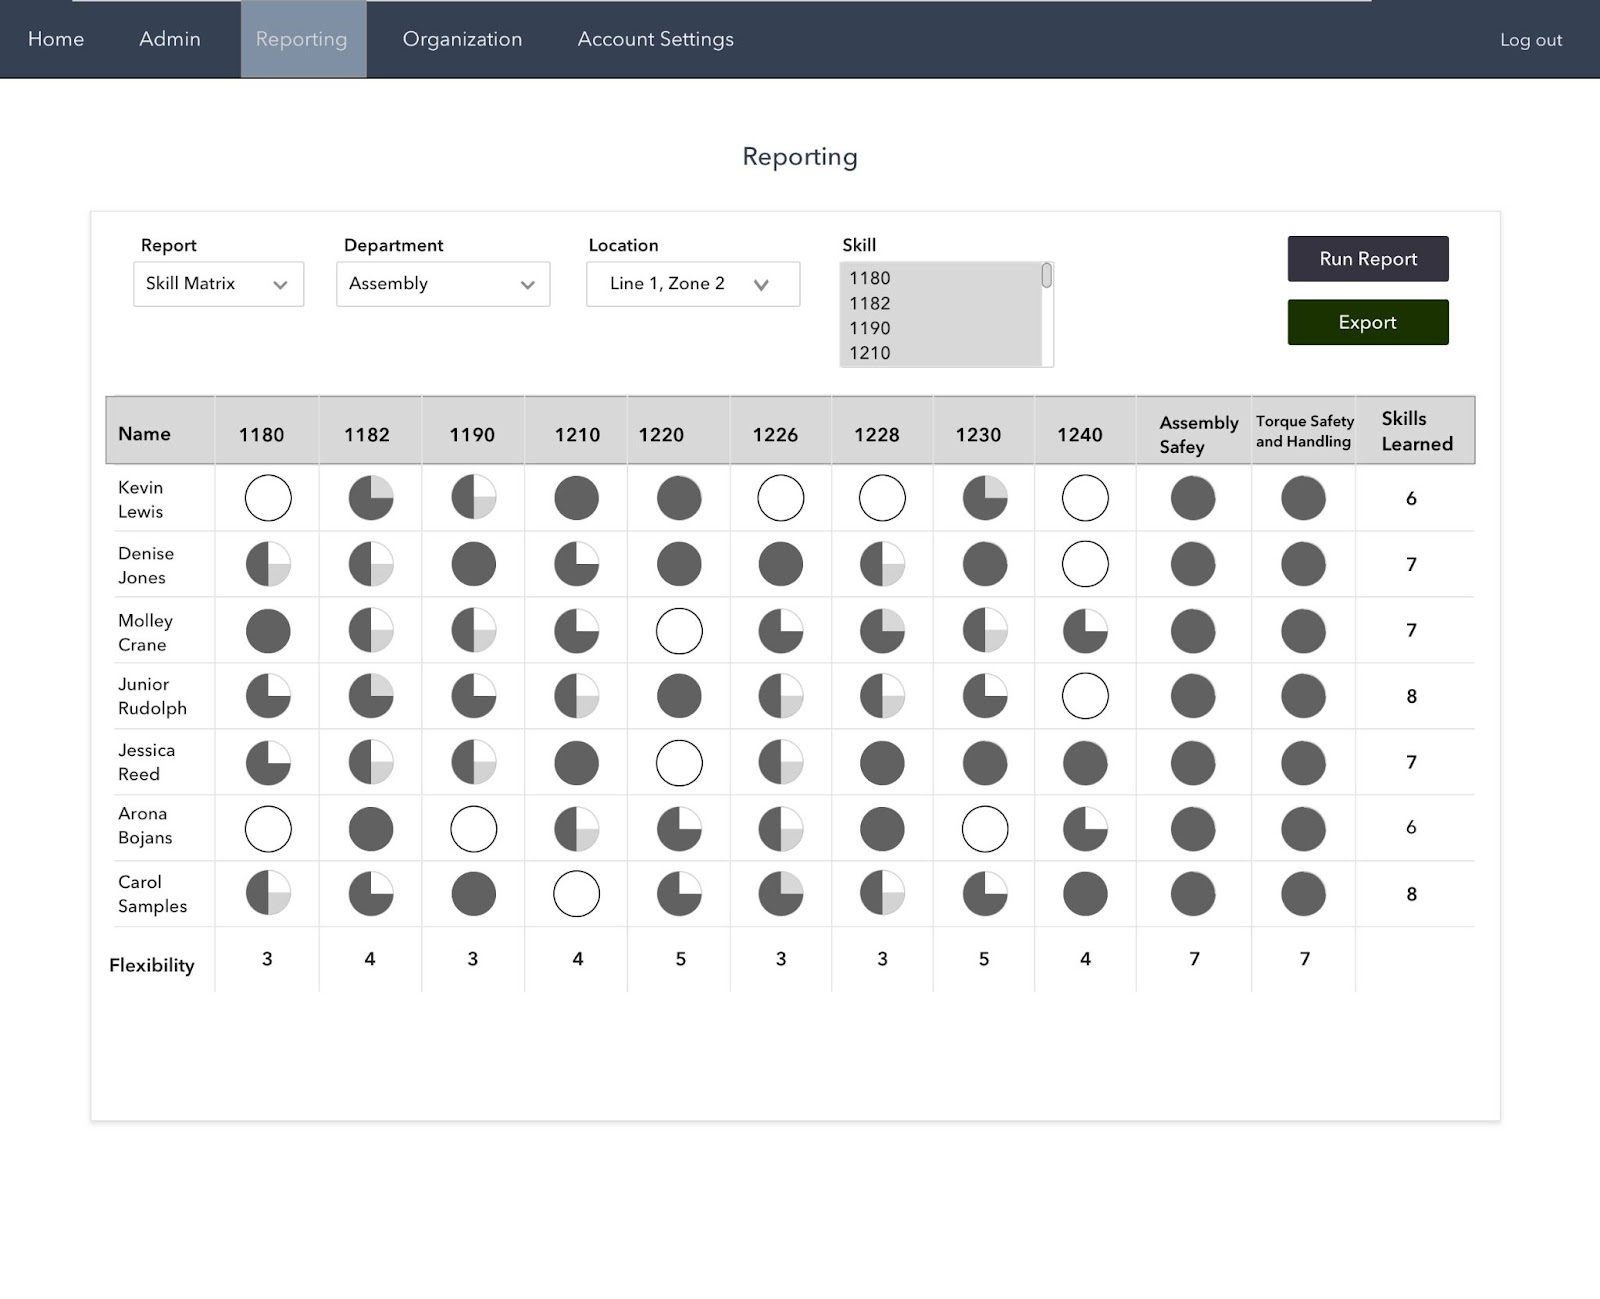
Harvey Ball matrices are common because they are easy to interpret on the shop floor and because they standardize all capabilities to four levels (e.g untrained, in-training, fully trained, and able to train others).
If capabilities are more complex to attain, require continuous renewal, or need to be grouped more flexibly, then numeric matrices can be a better option because they give a broader range of statuses
If it will be displayed on a shop floor screen or a kaizen board, consider a “stoplight matrix” because viewers can immediately see whether a cell is green, red, or yellow from a further distance.
Other elements to consider adding to your logic:
If applicable, we highly recommend adding renewal statuses that show when a worker is soon to expire or expired on a training so that action can be taken ASAP. This can potentially avoid major safety or compliance issues.
Consider incorporating logic for when a worker is eligible to train other workers on a specific procedure. For instance, they may be eligible when they’ve completed training themselves AND completed a “train the trainer” course. This can expand the potential training resources during a shift.
If possible, add employee availability information. Are they on-premise and available to be assigned work? Add that as a filter. If not possible, at a minimum, include employee contact information as a reference column. That way, if there is a capability gap on a shift, the frontline leader can contact a capable worker to see if they are able to fill in.
Any reference information that reduces an administrative step for frontline leaders could be valuable, but remember to balance adding supplementary reference information with “information overload”. As a rule of thumb, include a maximum of 3-5 reference columns on a matrix (e.g Name, ID, Title, Contact number). Any more columns could make it hard to access critical information quickly.
Making the switch: spreadsheet vs. digital matrix
[Full disclosure: Covalent offers a range of workforce analytics for manufacturing, including training matrices. This means we recommend digitizing training matrices in most cases. That said, the real reason we are such advocates for digital training matrices is mostly because we see the shortcomings of analog approaches on a daily basis.]
You may consider starting out with building a matrix in a spreadsheet, and, depending on your level of skill in Excel and the complexity and volume of data you are tracking, this could be a reasonable option. In fact, most organizations continue to rely on paper or spreadsheets to manage all of their workforce capability data, but this can lead to big problems down the road. Here are a few main shortcomings we see:
Because spreadsheet matrices aren’t updated in real-time and source data needs to be manually added, they trend towards low fidelity even in the best of circumstances. Not only can incorrect or outdated data pose safety and regulatory risks, if frontline workers lose trust in them as a point of reference, it defeats the purpose of the matrix altogether.
Standardization and version control become increasingly untenable with spreadsheet matrices at scale. As training programs expand to many areas and many functions, it becomes increasingly hard to control for deviation from the intended standards and the data maintenance process. We’ve seen facilities with literally hundreds of area-specific matrices, none of which are centrally controlled.
Spreadsheet matrices are typically unable to receive as many valuable data inputs as digital ones because they lack modern APIs. For example, if a matrix doesn’t import clock-in data from an HR system, it cannot filter down to workers who are actually on premise before a shift. This diminishes its value as a decision making tool on the floor.
When we digitize a matrix and the underlying collection process data—from assignment to completion to renewal—we solve these issues. For example:
By updating information in real-time and reducing manual data entry, we improve data quality and maintain frontline trust.
Permission management and automated versioning rules streamline administration and reduce failure points.
Our APIs can import a range of workforce and manufacturing data to build a better picture of individual capability.
While we feel these are critical improvements from offline processes, they only exist in partnership with a client team who deeply understands their users and operational needs. So, whether you decide to start with an offline matrix or a digital one, our best advice is to focus on designing with your frontline workforce in mind.
To learn more about setting up a new digital manufacturing training matrix or converting an analog one to digital, contact us today.
Related posts
|
May 27, 2025
Implementation Best Practices with Jim Hamilton
Leading a software implementation project can seem like a daunting task, particularly within a complex manufacturing operation. We recently sat down with Jim Hamilton, an implementation manager and veteran project leader here at Covalent to hear his perspective on implementing enterprise software like Covalent and how he has seen clients do it really well.
Navigating the Challenges of Work Assignment Decisions
Supervisors face a tough challenge: making complex assignment decisions in a short time before each shift. In this blog, we'll delve into the intricacies of this task and explore how different factors can impact shift outcomes.
Oops! Something went wrong while submitting the form.
By using this website, you agree to the storing of cookies on your device to enhance site navigation, analyze site usage, and assist in our marketing efforts. View our Privacy Policy for more information.
.avif)
.avif)